

Run your project numbers before reading on. Use the Fundingwise development finance calculator
LTC and LTGDV: what they reveal about your deal
Two ratios govern how much a lender will advance on a development project: loan-to-cost (LTC) and loan-to-gross development value (LTGDV). Lenders apply both at once, and the more restrictive of the two sets the ceiling on the facility. For a full walkthrough of how these fit into the overall funding process, see our guide to the development finance process.
- LTC measures your loan as a percentage of total project cost: land, build, contingency and fees. The standard ceiling is around 90%, though most lenders reserve that for experienced developers with a demonstrable track record.
- LTGDV measures the same loan against your projected end value once the scheme completes. The market ceiling is around 70%.
In practice, loan to GDV is almost always the limit you hit first. Unless your scheme carries an unusually high margin (GDV of 1.3 times cost or above), you will hit the 70% LTGDV ceiling before you reach 90% LTC. The calculator applies both and tells you which one is limiting your maximum loan.
LTC and LTGDV don’t tell you whether a lender will advance to those limits on your deal. The ratios describe your position on paper. Whether a lender funds it depends on everything underneath them.
The free development finance calculator
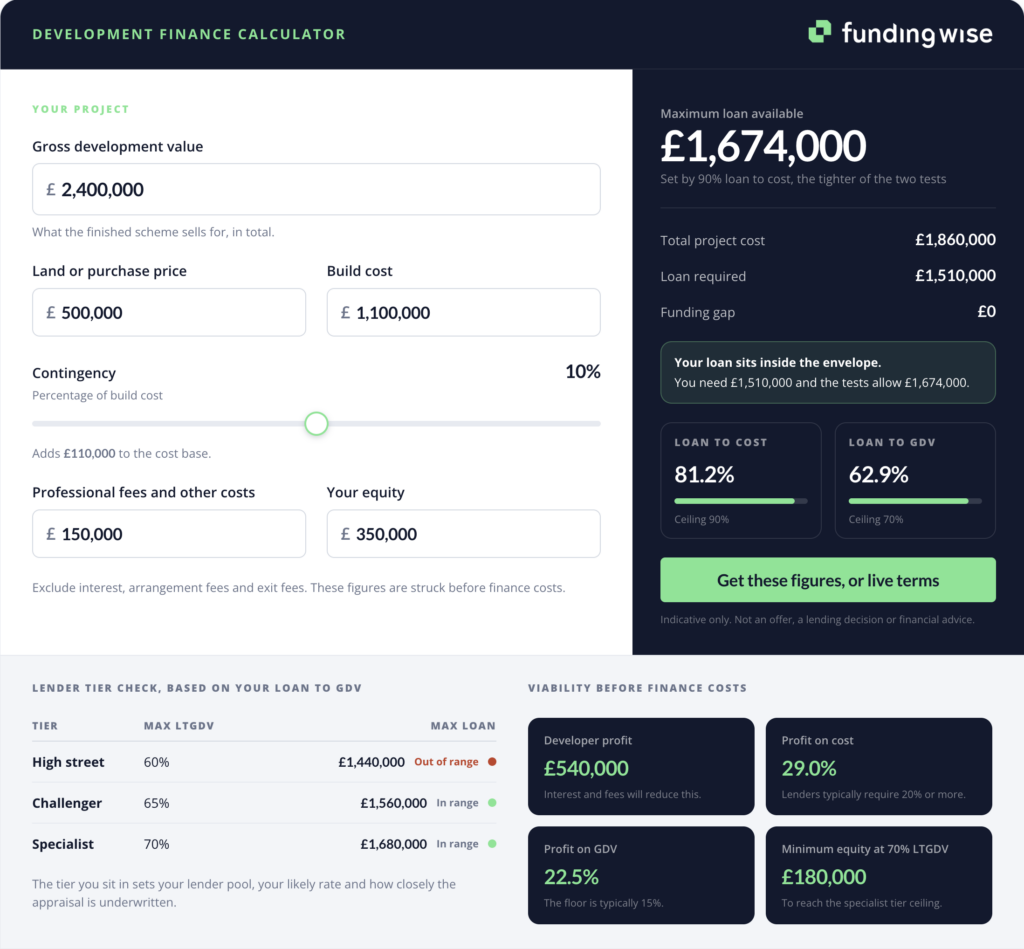
The calculator shows where your deal sits against market thresholds. It cannot show whether your appraisal will hold up under lender scrutiny.
Understanding different lender tiers
Where your LTGDV lands determines which lenders will consider your deal. High street lenders typically want LTGDV below 60%, and they apply conservative criteria across the board: scheme type, location, borrower profile and pre-sales evidence all factor in. Challenger lenders work up to around 65% and take a broader view of what constitutes an acceptable project. Specialist lenders go to 70% and, in some cases, stretch beyond that through mezzanine structuring.
The tier also sets the size of your lender pool, the scrutiny your appraisal faces, and the weight lenders put on your track record. Our article on development finance rates covers how lender fit and leverage shape the deal. A deal at 58% LTGDV with strong comparables and a clean exit is a different conversation from a deal at 68% LTGDV where the GDV is based on optimistic assumptions or the exit hasn’t been planned.
Specialist lenders are no more generous than the high street. They take higher leverage because they underwrite every line of the appraisal more closely. If your deal sits in specialist territory, work with a specialist development finance broker who understands what that level of scrutiny requires.
Profit on cost: the check most developers underweight
Profit on cost is the ratio lenders use as their primary viability test. The calculation: GDV minus total project cost, divided by total cost. Most lenders require a minimum of 20% before they will consider a scheme fundable.
The figures the calculator produces are pre-finance cost. Interest roll-up, arrangement fees and exit fees are not in the project cost inputs, so your post-finance profit will be lower than the figure the calculator shows.
Profit on cost benchmarks
On a typical development finance facility over 12 to 18 months, finance costs can run to 10 to 15% of the loan amount. A pre-finance profit on cost of 22% can become marginal by the time those costs are applied, and lenders will pick that up. That is why the calculator flags anything below 20% as a point to resolve before approaching a lender.
Lenders will stress-test your margins harder than you will. Build in the buffer at the appraisal stage.
What our development finance calculator cannot tell you
Three things most often sink a deal that looks fundable on paper: a GDV assumption that doesn’t hold up under scrutiny, a cost schedule that lacks credible contingency, and an exit strategy that hasn’t been properly defined.
GDV defensibility
Your GDV is only as good as the comparable evidence behind it. Lenders commission their own RICS valuations, and where a developer’s GDV sits above what comparables support, the lender’s valuation will come in lower. That reprices the entire deal.
Build your GDV from local comparable sales, with a professional appraisal behind it. That is what keeps the deal alive when the lender’s valuer arrives on site.
Cost schedule and contingency
Lenders expect contingency of 10%+ on build costs, and they look at whether the figure has been stress-tested or is the minimum needed to make the numbers work.
A cost schedule that has been built up from a QS report carries more weight than one assembled backwards from a target LTC. Lenders who have seen enough schemes know the difference.
Exit strategy
Whether you are selling units on completion, refinancing into a BTL portfolio, or holding stock for a period, lenders want to see a credible exit before they commit to a facility. A vague plan to sell at practical completion won’t satisfy them. A credit committee wants named agents, agreed marketing timelines and, where appropriate, pre-sales evidence.
Our article on the development finance legal process covers the legal preparation that runs alongside exit planning.
A well-run development finance calculator tells you whether a deal is structurally within lender appetite. The appraisal, the cost schedule and the exit strategy get it funded.
From calculator output to lender-ready deal
Running the numbers is the right place to start. It tells you which lender tier your deal sits in, whether your equity position is credible, and whether the margin exists before finance costs are applied. It also surfaces the gaps early, when there is still time to address them.
The work comes next: GDV evidence, a stress-tested cost schedule, a clear exit, and a professional team lenders recognise. That turns a deal that passes on paper into one that gets funded. If you are at an earlier stage and working through whether the deal makes sense at all, our article on development finance under tight market conditions is relevant context.
We work with developers at the appraisal stage, before they approach any lender. The conversations that go well are almost always the ones where the preparation is already done.
Book a free consultation | Call us: 020 4571 6186

Got a scheme to fund?
Property finance, in your inbox
Property finance insights from the Fundingwise team.
We'll email you a link to confirm. See our privacy policy for how we use your details.